2. Literature Review
2.1. Sustainable Development Goals and Sustainability Frameworks
The Sustainable Development Goals (SDGs), adopted by the United Nations in 2015, provide a globally integrated framework for addressing economic, social, and environmental sustainability challenges through 17 interrelated goals and 169 targets
| [1] | United Nations. (2015). Transforming Our World: The 2030 Agenda for Sustainable Development. United Nations, New York. |
| [2] | Halkos, G. and Gkampoura, E. C. (2021). “Where do we stand on the 17 Sustainable Development Goals? An overview on progress”, Economic Analysis and Policy, Vol. 70, pp. 94–122. |
[1, 2]
. Unlike the Millennium Development Goals (MDGs), which primarily focused on social development issues in developing countries, the SDGs adopt a broader and universal sustainability agenda that applies to both developed and developing economies
| [3] | Ashraf, M., Ullah, L., Shuvro, M. A. and Salma, U. (2019). “Transition from Millennium Development Goals (MDGs) to Sustainable Development Goals (SDGs): Blueprint of Bangladesh for implementing the Sustainable Development Goals (SDGs) 2030”, Medicine Today, Vol. 31 No. 1, pp. 46–59. |
[3]
. The SDGs emphasise interconnectedness among poverty reduction, environmental protection, economic growth, infrastructure development, climate action, and institutional governance
| [4] | Fonseca, L. M., Domingues, J. P. and Dima, A. M. (2020). “Mapping the sustainable development goals relationships”, Sustainability, Vol. 12 No. 8, p. 3359. |
[4]
. Consequently, achieving these goals requires coordinated participation from governments, industries, civil society organisations, and the private sector.
Scholars generally agree that the SDGs represent a transformative framework for global sustainability governance because they integrate economic, social, and environmental dimensions into a unified development agenda
| [5] | McCollum, D. L., Echeverri, L. G., Busch, S., Pachauri, S., Parkinson, S., Rogelj, J., et al. (2018). “Connecting the sustainable development goals by their energy inter-linkages”, Environmental Research Letters, Vol. 13 No. 3, p. 033006.
https://doi.org/10.1088/1748-9326/aaafe3 |
| [6] | Boar, A., Bastida, R. and Marimon, F. (2022). “A systematic literature review of the sustainable development goals (SDGs) with managerial implications”, Sustainability, Vol. 14 No. 15, p. 9282. |
[5, 6]
. However, debates remain regarding the practical implementation of the SDGs, particularly the challenges associated with balancing economic growth with environmental protection. While some researchers argue that the SDGs promote synergies among sustainability dimensions, others contend that substantial trade-offs persist between industrial development, resource consumption, and climate mitigation objectives
| [7] | Guevara, Z. and Julián, C. (2019). “The role of trade-offs and synergies in implementing the Sustainable Development Goals”, Sustainability Science, Vol. 14 No. 6, pp. 1629–1640. |
[7]
. This challenge is especially evident in the construction sector, where infrastructure expansion simultaneously supports economic development while contributing significantly to environmental degradation.
In response to these implementation challenges, sustainability assessment frameworks such as the Triple Bottom Line (TBL), Environmental, Social and Governance (ESG) frameworks, and circular economy principles have emerged as mechanisms for evaluating organisational sustainability performance
| [8] | Księżak, P. and Fischbach, B. (2018). “Triple Bottom Line: The Pillars of CSR”, Journal of Corporate Responsibility and Leadership, Vol. 4 No. 3, pp. 95–110. |
[8]
. The TBL framework conceptualises sustainability through the integration of economic prosperity, environmental stewardship, and social responsibility, commonly referred to as profit, planet, and people
| [9] | Slaper, T. F. and Hall, T. J. (2011). “The Triple Bottom Line: What Is It and How Does It Work?”, Indiana Business Review, Vol. 86 No. 1, pp. 4–8. |
[9]
. Although the TBL framework remains widely applied in construction sustainability studies, critics argue that it insufficiently captures governance and accountability dimensions that increasingly shape corporate sustainability performance.
Consequently, ESG frameworks have gained prominence in sustainability discourse because they incorporate governance dimensions such as transparency, ethical procurement, stakeholder engagement, labour standards, and institutional accountability
| [10] | Eccles, R. G., Lee, L. E. and Stroehle, J. C. (2020). “The social origins of ESG: An analysis of Innovest and KLD”, Organization & Environment, Vol. 33 No. 4, pp. 575–596. |
[10]
. Within the construction industry, ESG indicators are increasingly used to assess carbon emissions, occupational health and safety, waste management practices, energy efficiency, and community development contributions. Researchers argue that ESG frameworks strengthen sustainability reporting by providing measurable indicators capable of tracking firms’ contributions toward SDG achievement
| [11] | Wu, P., Song, Y., Shou, W., Chi, H. and Chong, H. Y. (2018). “Sustainable construction and the Sustainable Development Goals: A review of current progress and future opportunities”, Journal of Cleaner Production, Vol. 198, pp. 156–171. |
[11]
. Nevertheless, ESG implementation remains uneven across regions, with developing economies facing institutional limitations, weak regulatory systems, and limited sustainability disclosure mechanisms.
Similarly, sustainability indicator systems and construction sustainability indices such as LEED, BREEAM, Green Star, and Envision have become important tools for assessing environmental and social performance within the built environment
| [12] | Doan, D. T., Ghaffarianhoseini, A., Naismith, N., Zhang, T., Ghaffarianhoseini, A. and Tookey, J. (2017). “A critical comparison of green building rating systems”, Building and Environment, Vol. 123, pp. 243–260. |
[12]
. These frameworks evaluate construction projects using indicators related to energy efficiency, material sustainability, indoor environmental quality, biodiversity conservation, and lifecycle performance. Although these tools have improved sustainability benchmarking in developed economies, several scholars argue that they inadequately reflect the contextual realities of developing countries, particularly in Africa, where informal construction practices, weak enforcement mechanisms, and resource constraints influence sustainability implementation
| [13] | Darko, A., Chan, A. P. C., Yang, Y., Shan, M., He, B. J. and Gou, Z. (2017). “Drivers for green building: A review of empirical studies”, Habitat International, Vol. 60, pp. 34–49. |
[13]
. This suggests the need for context-specific approaches capable of evaluating sustainability performance under uncertain and dynamic conditions.
Overall, the literature demonstrates broad consensus regarding the importance of sustainability frameworks in guiding SDG implementation within industries. However, disagreements remain concerning the adequacy of existing sustainability measurement systems, particularly their applicability within developing-country construction sectors. This limitation creates the need for empirical studies capable of assessing how construction firms operationalise sustainability objectives within resource-constrained environments.
2.2. Construction Industry and Sustainable Development Goals
The construction industry occupies a central position within sustainable development discourse due to its substantial economic, environmental, and social impacts. Globally, the sector contributes significantly to economic growth through employment generation, infrastructure development, and urban expansion, while simultaneously exerting considerable pressure on natural resources and ecological systems
| [14] | Scrucca, F., Ingrao, C., Barberio, G., Matarazzo, A. and Lagioia, G. (2023). “On the role of sustainable buildings in achieving the 2030 UN Sustainable Development Goals”, Environmental Impact Assessment Review, Vol. 100, p. 107069. |
[14]
. Researchers consistently acknowledge that the industry directly influences several SDGs, particularly SDG 9 (Industry, Innovation and Infrastructure), SDG 11 (Sustainable Cities and Communities), SDG 7 (Affordable and Clean Energy), SDG 12 (Responsible Consumption and Production), and SDG 13 (Climate Action)
| [15] | Opoku, A. (2019). “BIM and sustainability: The role of construction professionals in achieving the Sustainable Development Goals (SDGs)”, Journal of Cleaner Production, Vol. 222, pp. 300–310. |
| [16] | Ofori, G. (2023). “Construction and the Sustainable Development Goals: Roles, contributions and challenges”, Engineering, Construction and Architectural Management, Vol. 30 No. 5, pp. 1752–1771. |
[15, 16]
.
Despite this recognised importance, the literature presents contrasting perspectives regarding the industry's sustainability performance. On one hand, scholars emphasise the transformative potential of the construction sector through green buildings, renewable energy integration, circular economy practices, and sustainable urban infrastructure development
| [17] | Dixon, T., Lannon, S. and Eames, M. (2019). “Sustainable urban development and the construction sector”, Building Research & Information, Vol. 47 No. 2, pp. 123–136. |
| [18] | Giesekam, J., Barrett, J. R. and Taylor, P. (2021). “Construction sector views on low carbon building materials”, Building Research & Information, Vol. 49 No. 1, pp. 1–15. |
[17, 18]
. Green construction practices have been associated with reduced operational energy consumption, improved resource efficiency, and enhanced resilience against climate-related risks. Similarly, proponents of sustainable construction argue that infrastructure development contributes positively to social welfare through improved housing, healthcare facilities, transportation systems, and educational infrastructure.
Conversely, other scholars emphasise the industry's negative environmental externalities. Construction activities remain among the largest contributors to greenhouse gas emissions, energy consumption, biodiversity loss, and construction waste generation
| [19] | United Nations Environment Programme (UNEP). (2021). Global Status Report for Buildings and Construction 2021. UNEP, Nairobi. |
[19]
. Omer and Noguchi argued that building materials significantly influence environmental sustainability because material extraction, transportation, and disposal generate substantial ecological impacts throughout project life cycles
| [20] | Omer, M. A. B. and Noguchi, T. (2020). “A conceptual framework for understanding the contribution of building materials in the achievement of Sustainable Development Goals (SDGs)”, Sustainable Cities and Society, Vol. 52, p. 101869. |
[20]
. Similarly, Mahpour contends that construction and demolition waste remains inadequately managed in many countries, thereby undermining SDG 12 and SDG 13 objectives
| [21] | Mahpour, A. (2020). “Prioritizing barriers to adopt circular economy in construction and demolition waste management”, Resources, Conservation and Recycling, Vol. 134, pp. 216–227. |
[21]
. These findings suggest that while the industry possesses substantial capacity to support sustainable development, current practices often remain inconsistent with sustainability principles.
The literature also highlights growing recognition of the construction sector’s social responsibilities beyond physical infrastructure delivery. Construction firms increasingly contribute to community development through educational support, sanitation projects, healthcare initiatives, skills development programmes, and charitable interventions
| [16] | Ofori, G. (2023). “Construction and the Sustainable Development Goals: Roles, contributions and challenges”, Engineering, Construction and Architectural Management, Vol. 30 No. 5, pp. 1752–1771. |
[16]
. For example, scholarship schemes, school renovations, health screening exercises, and water provision initiatives have been linked to SDGs 3, 4, 6, and 10
| [22] | Patel, K., Chaurasia, M., Singh, R., Bhadouria, R. and Rao, K. S. (2024). “Role of Blue-Green Infrastructure in Achieving Sustainable Development Goals in Urban Centres of Developing Countries”, in Joshi, P. K., Rao, K. S., Bhadouria, R., Tripathi, S. and Singh, R. (Eds.), Blue-Green Infrastructure for Sustainable Urban Settlements: Implications for Developing Countries Under Climate Change, Springer Nature Switzerland, pp. 111–135. |
[22]
. Similarly, workplace safety programmes and labour protection measures align with SDG 8 by promoting decent work conditions within construction environments.
However, significant concerns persist regarding social sustainability within the industry. Studies have identified issues relating to poor labour conditions, occupational hazards, corruption, modern slavery, and weak stakeholder engagement in construction supply chains
| [16] | Ofori, G. (2023). “Construction and the Sustainable Development Goals: Roles, contributions and challenges”, Engineering, Construction and Architectural Management, Vol. 30 No. 5, pp. 1752–1771. |
[16]
. While developed economies increasingly institutionalise sustainability reporting and labour protection systems, many developing countries continue to experience weak enforcement of sustainability regulations and occupational standards. This indicates that the industry's contribution to SDGs cannot merely be assessed through infrastructure provision alone but must also consider governance quality, social inclusion, and ethical operational practices.
The environmental dimension of construction sustainability has received substantial scholarly attention. Researchers generally agree that resource efficiency, waste minimisation, and circular economy adoption are essential for improving sustainability outcomes within the sector
| [20] | Omer, M. A. B. and Noguchi, T. (2020). “A conceptual framework for understanding the contribution of building materials in the achievement of Sustainable Development Goals (SDGs)”, Sustainable Cities and Society, Vol. 52, p. 101869. |
| [21] | Mahpour, A. (2020). “Prioritizing barriers to adopt circular economy in construction and demolition waste management”, Resources, Conservation and Recycling, Vol. 134, pp. 216–227. |
[20, 21]
. Circular economy principles encourage recycling, reuse, and lifecycle optimisation of construction materials to reduce environmental degradation and resource depletion. Nevertheless, implementation challenges remain significant in developing countries due to financial constraints, technological limitations, and low institutional capacity.
Although biodiversity conservation and ecosystem protection are increasingly recognised within sustainability discourse, these dimensions remain relatively underexplored within construction research. Opoku argued that urban development projects rarely prioritise biodiversity protection despite the sector’s substantial impact on ecosystems and land use patterns
| [15] | Opoku, A. (2019). “BIM and sustainability: The role of construction professionals in achieving the Sustainable Development Goals (SDGs)”, Journal of Cleaner Production, Vol. 222, pp. 300–310. |
[15]
. Similarly, SIDA emphasized that integrating biodiversity conservation measures such as green roofs, ecological landscaping, and habitat preservation into construction projects remains limited in many regions
| [23] | Swedish International Development Cooperation Agency (SIDA). (2023). Biodiversity and Sustainable Urban Development. SIDA Publications, Stockholm. |
[23]
. This demonstrates that sustainability implementation within the construction industry remains uneven across different SDG dimensions.
Another important debate within the literature concerns whether sustainability should be viewed primarily as a regulatory obligation or as a strategic opportunity for innovation and competitiveness. Some scholars argue that sustainability adoption improves operational efficiency, organisational reputation, and long-term competitiveness
| [24] | Gareis, R., Huemann, M. and Martinuzzi, A. (2020). “Project management and sustainable development principles”, International Journal of Project Management, Vol. 38 No. 8, pp. 512–524. |
[24]
. Others contend that many construction firms, particularly in developing economies, perceive sustainability initiatives as costly obligations that increase project complexity without generating immediate financial returns. These differing perspectives partly explain the inconsistent adoption of sustainability practices across construction sectors globally.
Overall, the literature demonstrates broad agreement that the construction industry significantly influences SDG achievement through its environmental, social, and economic impacts. Nevertheless, the extent and effectiveness of these contributions remain contested, particularly regarding the practical implementation of sustainability principles within developing-country contexts.
2.3. Sustainability Assessment Approaches in Construction
The growing complexity of sustainability challenges within the construction sector has increased the demand for robust sustainability assessment methods capable of evaluating multidimensional performance indicators. Traditional sustainability evaluation approaches have largely relied on quantitative environmental indicators such as energy consumption, carbon emissions, and material efficiency. However, scholars increasingly argue that sustainability assessment must also incorporate social, governance, and institutional dimensions to capture the full complexity of sustainable construction practices
| [25] | Sánchez, M. A. (2015). “Integrating sustainability issues into project management”, Journal of Cleaner Production, Vol. 96, pp. 319–330. |
[25]
.
Several sustainability assessment tools have been developed to evaluate construction performance across project lifecycles. Green building certification systems such as LEED, BREEAM, and Green Star remain among the most widely adopted sustainability assessment frameworks globally
| [12] | Doan, D. T., Ghaffarianhoseini, A., Naismith, N., Zhang, T., Ghaffarianhoseini, A. and Tookey, J. (2017). “A critical comparison of green building rating systems”, Building and Environment, Vol. 123, pp. 243–260. |
[12]
. These systems evaluate projects using criteria related to energy efficiency, indoor environmental quality, water conservation, waste management, and material sustainability. Researchers acknowledge that such frameworks have significantly improved sustainability awareness and benchmarking within developed construction markets.
Despite their popularity, scholars criticise these assessment tools for several reasons. First, many certification systems were developed within advanced economies and may inadequately reflect socio-economic realities in developing countries
| [13] | Darko, A., Chan, A. P. C., Yang, Y., Shan, M., He, B. J. and Gou, Z. (2017). “Drivers for green building: A review of empirical studies”, Habitat International, Vol. 60, pp. 34–49. |
[13]
. Second, most existing frameworks focus heavily on environmental indicators while paying comparatively less attention to social equity, governance quality, and community development contributions. Third, sustainability indicators often involve uncertainty, subjectivity, and qualitative judgement, making conventional quantitative assessment methods insufficient for capturing real-world sustainability performance.
To address these limitations, researchers increasingly advocate the application of fuzzy logic-based approaches in sustainability assessment. Fuzzy Synthetic Evaluation (FSE) has emerged as a particularly useful technique because it accommodates ambiguity, uncertainty, and subjective human judgement within complex decision-making environments
| [26] | Zhao, X., Hwang, B. G. and Gao, Y. (2016). “A fuzzy synthetic evaluation approach for risk assessment: A case of Singapore’s green projects”, Journal of Cleaner Production, Vol. 115, pp. 203–213. |
[26]
. Unlike traditional deterministic approaches, fuzzy synthetic evaluation enables researchers to evaluate sustainability performance using linguistic variables and weighted indicators, thereby improving analytical flexibility in situations where precise measurements are difficult to obtain.
Within construction research, fuzzy synthetic evaluation has been applied in areas such as risk assessment, safety management, environmental performance evaluation, and green project assessment
| [26] | Zhao, X., Hwang, B. G. and Gao, Y. (2016). “A fuzzy synthetic evaluation approach for risk assessment: A case of Singapore’s green projects”, Journal of Cleaner Production, Vol. 115, pp. 203–213. |
| [27] | Ameyaw, E. E. and Chan, A. P. C. (2016). “A fuzzy model for evaluating risk impacts on variability between contract sum and final account in government-funded construction projects”, Journal of Facilities Management, Vol. 14 No. 1, pp. 45–69. |
[26, 27]
. Researchers argue that FSE is particularly suitable for sustainability studies because sustainability indicators often involve qualitative assessments relating to social responsibility, community engagement, environmental protection, and organisational governance. Nevertheless, despite the growing use of fuzzy evaluation approaches within construction management research, relatively few studies have applied fuzzy synthetic evaluation to assess construction firms’ contributions toward SDG achievement, particularly within African contexts.
Moreover, existing sustainability assessment studies remain predominantly concentrated in developed economies such as the United Kingdom, Europe, Australia, Singapore, and China, where sustainability regulations, ESG disclosure systems, and green certification frameworks are more mature
| [17] | Dixon, T., Lannon, S. and Eames, M. (2019). “Sustainable urban development and the construction sector”, Building Research & Information, Vol. 47 No. 2, pp. 123–136. |
| [18] | Giesekam, J., Barrett, J. R. and Taylor, P. (2021). “Construction sector views on low carbon building materials”, Building Research & Information, Vol. 49 No. 1, pp. 1–15. |
| [26] | Zhao, X., Hwang, B. G. and Gao, Y. (2016). “A fuzzy synthetic evaluation approach for risk assessment: A case of Singapore’s green projects”, Journal of Cleaner Production, Vol. 115, pp. 203–213. |
[17, 18, 26]
. Empirical evidence from developing countries remains fragmented despite the distinct institutional and socio-economic conditions influencing sustainability implementation within these regions.
This suggests that existing sustainability assessment literature remains limited in three major respects. First, many studies remain conceptual rather than empirically measuring actual sustainability practices at firm level. Second, existing frameworks inadequately capture the contextual realities of developing-country construction sectors. Third, limited studies have integrated fuzzy synthetic evaluation techniques with SDG-oriented sustainability assessment models.
2.4. Research Gap
Although substantial literature exists regarding sustainability and SDG implementation within the construction industry, important theoretical, empirical, and methodological gaps remain unresolved. Existing studies predominantly focus on the conceptual role of construction in sustainable development rather than empirically evaluating the actual extent of construction firms’ SDG-related activities. Much of the literature assumes that construction organisations significantly contribute to sustainable development through infrastructure delivery and green building initiatives; however, limited empirical evidence exists regarding the frequency and practical implementation of these activities, particularly in developing economies.
Furthermore, current scholarship is heavily dominated by studies conducted within developed countries where sustainability governance systems, ESG disclosure frameworks, and environmental regulations are relatively advanced
| [17] | Dixon, T., Lannon, S. and Eames, M. (2019). “Sustainable urban development and the construction sector”, Building Research & Information, Vol. 47 No. 2, pp. 123–136. |
| [18] | Giesekam, J., Barrett, J. R. and Taylor, P. (2021). “Construction sector views on low carbon building materials”, Building Research & Information, Vol. 49 No. 1, pp. 1–15. |
| [26] | Zhao, X., Hwang, B. G. and Gao, Y. (2016). “A fuzzy synthetic evaluation approach for risk assessment: A case of Singapore’s green projects”, Journal of Cleaner Production, Vol. 115, pp. 203–213. |
[17, 18, 26]
. In contrast, empirical evidence from sub-Saharan Africa remains limited despite the region facing rapid urbanisation, infrastructure deficits, environmental vulnerability, and institutional challenges that may significantly influence sustainability practices within the construction sector.
Methodologically, previous studies have largely relied on descriptive sustainability indicators and conventional quantitative assessment approaches. Limited studies have employed fuzzy synthetic evaluation techniques to assess construction firms’ contributions to SDGs under conditions of uncertainty and subjective judgement. Consequently, there remains insufficient understanding regarding how construction organisations in developing economies operationalise sustainability practices and contribute toward SDG achievement.
Therefore, this study contributes to the literature by empirically evaluating the contribution of construction organisations toward achieving the SDGs within the Ghanaian construction industry using exploratory factor analysis and fuzzy synthetic evaluation modelling. The study provides methodological, empirical, and contextual contributions by integrating sustainability assessment frameworks with fuzzy logic techniques within a developing-country context.
3. Research Design
This study adopted a quantitative research design to examine the contributions of construction organisations toward achieving the Sustainable Development Goals (SDGs) in Ghana. Quantitative research is appropriate for studies that seek to objectively measure perceptions, patterns, and relationships using numerical data and statistical analysis
| [1] | United Nations. (2015). Transforming Our World: The 2030 Agenda for Sustainable Development. United Nations, New York. |
[1]
. The study was grounded in the positivist philosophical paradigm because it enables empirical investigation and objective evaluation of observable phenomena. A questionnaire survey strategy was employed because it facilitates the collection of standardized data from a relatively large sample and is widely used in construction management and sustainability studies
| [2] | Halkos, G. and Gkampoura, E. C. (2021). “Where do we stand on the 17 Sustainable Development Goals? An overview on progress”, Economic Analysis and Policy, Vol. 70, pp. 94–122. |
[2]
. The study sought to identify the major sustainable development activities undertaken by construction organisations and evaluate the frequency of their engagement in such activities using Exploratory Factor Analysis (EFA) and Fuzzy Synthetic Evaluation Modelling (FSEM).
3.1. Population and Sampling Procedure
The target population for the study consisted of all registered construction firms operating in Ghana under the Ministries of Works and Housing (MWH) and Roads and Highways (MRH). The accessible population comprised contractors registered with the Association of Building and Civil Engineering Contractors of Ghana (ABCECG) and the Association of Road Contractors (ASROC). Given the heterogeneous nature of construction firms, stratified random sampling was adopted to ensure adequate representation of both building and road contractors. Stratified sampling is suitable where the population contains distinct subgroups because it improves representativeness and reduces sampling error
| [3] | Ashraf, M., Ullah, L., Shuvro, M. A. and Salma, U. (2019). “Transition from Millennium Development Goals (MDGs) to Sustainable Development Goals (SDGs): Blueprint of Bangladesh for implementing the Sustainable Development Goals (SDGs) 2030”, Medicine Today, Vol. 31 No. 1, pp. 46–59. |
[3]
. Two strata were therefore established:
1) Building contractors
2) Road contractors
A list of contractors in good standing as of December 2024 was obtained from the secretariats of ABCECG and ASROC. During verification of the sampling frame, several firms listed in the associations’ databases were found to be inactive or unreachable through the contact details provided. Such firms were excluded from the sampling frame to improve coverage accuracy. Additionally, active contractors verified through professional association referrals and industry records were included to ensure that the final sampling frame adequately reflected operational construction firms in Ghana. The final sampling frame comprised 527 road contractors and 653 building contractors.
3.2. Sample Size Determination
The sample size was determined using the Yamane formula for finite populations
| [4] | Fonseca, L. M., Domingues, J. P. and Dima, A. M. (2020). “Mapping the sustainable development goals relationships”, Sustainability, Vol. 12 No. 8, p. 3359. |
[4]
:
Where:
1) = sample size
2) = population size
3) = level of precision (0.05)
A 95% confidence level and 5% margin of error were assumed following established recommendations
| [5] | McCollum, D. L., Echeverri, L. G., Busch, S., Pachauri, S., Parkinson, S., Rogelj, J., et al. (2018). “Connecting the sustainable development goals by their energy inter-linkages”, Environmental Research Letters, Vol. 13 No. 3, p. 033006.
https://doi.org/10.1088/1748-9326/aaafe3 |
[5]
. Based on the calculation, the minimum required sample size was 298.73, approximated to 299 respondents. To improve response adequacy and account for potential non-response, the sample size was increased by 20%, resulting in 357 distributed questionnaires. This adjustment was necessary because survey response rates within the Ghanaian construction industry are generally low. Out of the 357 questionnaires distributed, 250 valid responses were received, representing a response rate of approximately 70.0%, which was considered adequate for multivariate statistical analysis and factor analysis.
3.3. Questionnaire Design and Construct Operationalisation
Data were collected using a structured questionnaire specifically developed for this study. The questionnaire was designed based on an extensive review of literature relating to sustainable construction practices and SDGs contributions within the construction industry
| [6] | Boar, A., Bastida, R. and Marimon, F. (2022). “A systematic literature review of the sustainable development goals (SDGs) with managerial implications”, Sustainability, Vol. 14 No. 15, p. 9282. |
| [7] | Guevara, Z. and Julián, C. (2019). “The role of trade-offs and synergies in implementing the Sustainable Development Goals”, Sustainability Science, Vol. 14 No. 6, pp. 1629–1640. |
| [8] | Księżak, P. and Fischbach, B. (2018). “Triple Bottom Line: The Pillars of CSR”, Journal of Corporate Responsibility and Leadership, Vol. 4 No. 3, pp. 95–110. |
[6-8]
.
The questionnaire consisted of two main sections.
Section A: Demographic Information
This section captured respondents’ background characteristics, including contractor category, job position, educational qualification, years of industry experience, and years of company existence.
Section B: Sustainable Development Goals Activities
This section measured construction organisations’ contributions toward SDGs using twenty indicators extracted from the literature
| [6] | Boar, A., Bastida, R. and Marimon, F. (2022). “A systematic literature review of the sustainable development goals (SDGs) with managerial implications”, Sustainability, Vol. 14 No. 15, p. 9282. |
| [7] | Guevara, Z. and Julián, C. (2019). “The role of trade-offs and synergies in implementing the Sustainable Development Goals”, Sustainability Science, Vol. 14 No. 6, pp. 1629–1640. |
| [8] | Księżak, P. and Fischbach, B. (2018). “Triple Bottom Line: The Pillars of CSR”, Journal of Corporate Responsibility and Leadership, Vol. 4 No. 3, pp. 95–110. |
[6-8]
. The indicators were operationalised into five theoretical dimensions:
1) Infrastructure Restoration
2) Health and Well-being
3) Social Development
4) Human Development
5) Sports Development
Respondents were asked to indicate the frequency with which their organisations engaged in each activity using a five-point Likert scale:
1 = Never
2 = Very Rarely
3 = Rarely
4 = Occasionally
5 = Always
The five-point Likert scale was adopted because it provides adequate discrimination among responses while reducing respondent fatigue and improving response reliability in construction management research.
3.4. Validity and Reliability of the Instrument
To ensure content validity, the questionnaire items were developed from established literature and aligned with the theoretical dimensions underpinning the Sustainable Development Goals. The instrument was subsequently reviewed by two experts in construction management and sustainability research to assess the relevance, clarity, and comprehensiveness of the items. A pilot study involving selected construction professionals was conducted in May 2025 to assess the suitability and clarity of the questionnaire items before the main survey administration. Feedback obtained from the pilot study resulted in minor modifications to wording and item structure to improve clarity and comprehension.
Construct validity was assessed using Exploratory Factor Analysis (EFA). Prior to factor extraction, the Kaiser-Meyer-Olkin (KMO) Measure of Sampling Adequacy and Bartlett’s Test of Sphericity were conducted to evaluate the suitability of the dataset for factor analysis. The KMO value of 0.800 exceeded the recommended threshold of 0.70, while Bartlett’s Test of Sphericity was statistically significant (p < 0.001), confirming factorability of the correlation matrix
| [9] | Slaper, T. F. and Hall, T. J. (2011). “The Triple Bottom Line: What Is It and How Does It Work?”, Indiana Business Review, Vol. 86 No. 1, pp. 4–8. |
| [10] | Eccles, R. G., Lee, L. E. and Stroehle, J. C. (2020). “The social origins of ESG: An analysis of Innovest and KLD”, Organization & Environment, Vol. 33 No. 4, pp. 575–596. |
[9, 10]
. Internal consistency reliability was assessed using Cronbach’s alpha coefficients. The reliability results indicated satisfactory internal consistency for all constructs, exceeding the recommended threshold of 0.70
| [10] | Eccles, R. G., Lee, L. E. and Stroehle, J. C. (2020). “The social origins of ESG: An analysis of Innovest and KLD”, Organization & Environment, Vol. 33 No. 4, pp. 575–596. |
[10]
. Infrastructure Restoration recorded α = 0.821, Health and Well-being α = 0.847, Social Development α = 0.803, Human Development α = 0.791, and Sports Development α = 0.754. The overall scale reliability was α = 0.868.
Although Confirmatory Factor Analysis (CFA) could provide additional validation, the present study was exploratory in nature and primarily aimed at identifying latent dimensions underlying SDGs activities. Future studies are encouraged to apply CFA and Structural Equation Modelling using larger datasets for confirmatory validation.
3.5. Assessment of Response Bias and Non-response Bias
To minimise response bias, respondents were assured of anonymity and confidentiality, and participation was entirely voluntary. This approach was intended to reduce socially desirable responses and encourage honest reporting.
Non-response bias was assessed by comparing early and late respondents using independent sample t-tests on selected study variables. The analysis revealed no statistically significant differences between the two groups (p > 0.05), suggesting that non-response bias did not significantly affect the study findings.
3.6. Exploratory Factor Analysis
Exploratory Factor Analysis (EFA) was employed to identify the underlying dimensions of SDGs activities undertaken by construction organisations. Principal Component Analysis (PCA) was adopted as the extraction technique because the study sought to reduce a large set of interrelated variables into a smaller number of interpretable components
| [9] | Slaper, T. F. and Hall, T. J. (2011). “The Triple Bottom Line: What Is It and How Does It Work?”, Indiana Business Review, Vol. 86 No. 1, pp. 4–8. |
| [10] | Eccles, R. G., Lee, L. E. and Stroehle, J. C. (2020). “The social origins of ESG: An analysis of Innovest and KLD”, Organization & Environment, Vol. 33 No. 4, pp. 575–596. |
[9, 10]
.
Varimax rotation with Kaiser Normalisation was applied to improve interpretability and minimise cross-loadings among variables. Only variables with factor loadings equal to or greater than 0.40 were retained for interpretation.
The extracted factors were interpreted and named based on conceptual similarity among highly loading variables and alignment with sustainable development literature. Five components with eigenvalues greater than 1.0 were retained, cumulatively explaining 70.629% of the total variance, exceeding the recommended minimum threshold of 50%
| [9] | Slaper, T. F. and Hall, T. J. (2011). “The Triple Bottom Line: What Is It and How Does It Work?”, Indiana Business Review, Vol. 86 No. 1, pp. 4–8. |
[9]
.
3.7. Fuzzy Synthetic Evaluation Model (FSEM)
Following the identification of the underlying dimensions of SDGs activities, the Fuzzy Synthetic Evaluation Model (FSEM) was employed to assess the frequency and relative significance of the identified activities.
Fuzzy Synthetic Evaluation is suitable for handling uncertainty and subjective judgments associated with social science data and Likert-scale responses
| [11] | Wu, P., Song, Y., Shou, W., Chi, H. and Chong, H. Y. (2018). “Sustainable construction and the Sustainable Development Goals: A review of current progress and future opportunities”, Journal of Cleaner Production, Vol. 198, pp. 156–171. |
[11]
. The model was implemented in four stages.
Step 1: Establishment of Factor Set
The factor set was defined as:
where represents the SDGs activity indicators.
Step 2: Establishment of Evaluation Set
The evaluation set was expressed as:
representing:
1) Never,
2) Very Rarely,
3) Rarely,
4) Occasionally,
5) and Always.
Step 3: Determination of Weights
Indicator weights were computed using the normalised mean method recommended in previous studies
| [12] | Doan, D. T., Ghaffarianhoseini, A., Naismith, N., Zhang, T., Ghaffarianhoseini, A. and Tookey, J. (2017). “A critical comparison of green building rating systems”, Building and Environment, Vol. 123, pp. 243–260. |
[12]
:
where:
1) = normalised weight of indicator ,
2) = mean score of the indicator .
The weighting process was used to establish the relative significance of each SDGs activity based on respondents’ ratings.
Step 4: Construction of Fuzzy Evaluation Matrix
Membership functions were estimated from the proportional distribution of respondents’ ratings across the five-point Likert scale. The fuzzy evaluation matrix was expressed as:
The overall fuzzy synthetic evaluation vector was computed as:
where:
1) represents the comprehensive evaluation result,
2) denotes the weighting vector,
3) and represents the fuzzy evaluation matrix.
To validate the stability of the weighting structure, the normalised mean weights were compared with equal-weight estimations. The ranking patterns remained substantially unchanged, confirming the robustness of the weighting scheme.
Additionally, sensitivity analysis was conducted by varying indicator weights by ±10% to examine the stability of factor rankings. The analysis showed only marginal changes in index values with no significant changes in ranking positions, confirming the robustness and reliability of the FSEM results.
4. Data Analysis and Interpretation
4.1. Demographic Information of Respondents
The demographic profile of respondents was analysed to establish the suitability and reliability of the data collected from construction professionals.
Table 1 presents the demographic characteristics of respondents based on contractor category, job position, educational qualification, years of industry experience, and years of company existence.
Table 1. Background information of respondents.
| Frequency | Percent |
Respondents' category | | |
Road | 95 | 38 |
Building | 155 | 62 |
Total | 250 | 100 |
Job Position | | |
Director | 22 | 8.8 |
Managing Director | 14 | 5.6 |
Safety Officer | 38 | 15.2 |
Project Engineer | 73 | 29.2 |
Project Manager | 53 | 21.2 |
Others | 50 | 20 |
Total | 250 | 100.0 |
Educational Level | | |
PhD | 3 | 1.2 |
MSC | 64 | 25.6 |
BSC | 91 | 36.4 |
B-TEC | 30 | 12 |
HND | 42 | 16.8 |
Others | 20 | 8 |
Total | 250 | 100.0 |
Years of Experience | | |
Less than 6 years | 54 | 21.6 |
6-10 years | 79 | 31.6 |
11-15 years | 87 | 34.8 |
16-20 years | 30 | 12 |
Total | 250 | 100 |
Years of the existence of the company | | |
5-10 years | 63 | 25.2 |
11-15 years | 62 | 24.8 |
16-20 years | 57 | 22.8 |
More than 20 years | 56 | 22.4 |
Others | 12 | 4.8 |
Total | 250 | 100.0 |
The results indicate that building contractors constituted the majority of respondents (62%), while road contractors represented 38% of the sample. This suggests relatively higher participation from firms engaged in building construction activities. In terms of professional designation, Project Engineers formed the largest respondent group (29.2%), followed by Project Managers (21.2%) and Safety Officers (15.2%). The participation of technically experienced professionals enhances the credibility of the responses because these personnel are directly involved in project delivery and sustainability-related decision-making processes.
Regarding educational qualification, most respondents possessed Bachelor of Science degrees (36.4%) and Master’s degrees (25.6%), indicating a relatively high educational background among respondents. Furthermore, the majority of respondents had between 11 and 15 years of construction industry experience (34.8%), while many firms had operated for between 5 and 15 years. These findings imply that respondents possessed adequate industry knowledge and organisational experience to provide reliable assessments of SDGs-related activities within their firms.
The demographic profile, therefore, demonstrates that the respondents were sufficiently qualified and experienced to provide valid insights into the sustainability practices of construction organisations in Ghana.
4.2. Exploratory Factor Analysis of SDGs Activities
Exploratory Factor Analysis (EFA) was conducted to identify the underlying dimensions of Sustainable Development Goals (SDGs) activities undertaken by construction organisations see
Table 2. Prior to extraction, the suitability of the data for factor analysis was assessed using the Kaiser-Meyer-Olkin (KMO) Measure of Sampling Adequacy and Bartlett’s Test of Sphericity.
The KMO value was 0.800, exceeding the recommended minimum threshold of 0.70
| [9] | Slaper, T. F. and Hall, T. J. (2011). “The Triple Bottom Line: What Is It and How Does It Work?”, Indiana Business Review, Vol. 86 No. 1, pp. 4–8. |
| [10] | Eccles, R. G., Lee, L. E. and Stroehle, J. C. (2020). “The social origins of ESG: An analysis of Innovest and KLD”, Organization & Environment, Vol. 33 No. 4, pp. 575–596. |
[9, 10]
, thereby confirming sampling adequacy. Bartlett’s Test of Sphericity was statistically significant (χ² = 686.391, p < 0.001), indicating that sufficient correlations existed among the variables to justify factor analysis.
Principal Component Analysis (PCA) with Varimax rotation was employed to extract the latent dimensions underlying SDGs activities. PCA was selected because the study aimed to reduce a relatively large number of interrelated sustainability indicators into a smaller number of interpretable components
| [9] | Slaper, T. F. and Hall, T. J. (2011). “The Triple Bottom Line: What Is It and How Does It Work?”, Indiana Business Review, Vol. 86 No. 1, pp. 4–8. |
[9]
. Five components with eigenvalues greater than 1.0 were extracted, cumulatively explaining 70.629% of the total variance, which exceeds the minimum threshold of 50% recommended for social science research
| [10] | Eccles, R. G., Lee, L. E. and Stroehle, J. C. (2020). “The social origins of ESG: An analysis of Innovest and KLD”, Organization & Environment, Vol. 33 No. 4, pp. 575–596. |
[10]
.
Unlike arbitrary statistical grouping, the extracted factors exhibited strong conceptual coherence and theoretical alignment with sustainable development literature. The factor structure, therefore, demonstrates both statistical validity and logical consistency.
Table 2. Exploratory Factor Analysis Sustainable Development Goals Activities.
| Extraction | Component |
1 | 2 | 3 | 4 | 5 |
Environmental protection education | 0.674 | 0.473 | | | | |
Provision of water | 0.466 | 0.486 | | | | |
supply of furniture to schools | 0.673 | 0.641 | | | | |
Building of community clinic | 0.631 | 0.742 | | | | |
Renovation of school | 0.628 | 0.743 | | | | |
Renovation of Hospitals | 0.686 | 0.746 | | | | |
Provision of counselling | 0.706 | | 0.556 | | | |
Health Education/Screening | 0.709 | | 0.779 | | | |
Safety Drills | 0.759 | | 0.787 | | | |
Fire prevention Education | 0.721 | | 0.837 | | | |
Building school blocks | 0.526 | | | 0.415 | | |
Support to orphanages | 0.774 | | | 0.752 | | |
support for the work of NGOs | 0.850 | | | 0.819 | | |
Medical support to the poor and needy | 0.718 | | | 0.729 | | |
Provision of Scholarship scheme | 0.673 | | | | 0.448 | |
Preservation of monuments | 0.576 | | | | 0.452 | |
Sanitation | 0.622 | | | | 0.705 | |
Provision of skills training | 0.724 | | | | 0.768 | |
Building of Recreational centres | 0.466 | | | | | 0.455 |
Sponsorship of sporting activities | 0.744 | | | | | 0.813 |
Total | - | 2.922 | 2.800 | 2.671 | 2.224 | 1.390 |
% of Variance | - | 17.186 | 16.470 | 15.713 | 13.081 | 8.179 |
Cumulative% | - | 17.186 | 33.656 | 49.369 | 62.450 | 70.629 |
Kaiser-Meyer-Olkin Measure of Sampling Adequacy. | 0.800 | | | | | |
Bartlett's Test of Sphericity | - | | | | | |
Approx. Chi-Square | 686.391 | | | | | |
df | 136 | | | | | |
Sig. | 0.000 | | | | | |
Extraction Method: Principal Component Analysis. Rotation Method: Varimax with Kaiser Normalization. a. Rotation converged in 9 iterations. | |
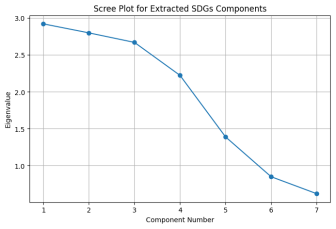
The scree plot demonstrates that the first five components accounted for substantial variance before the eigenvalues began to level off, confirming the appropriateness of the five-factor structure.
Figure 1. Scree Plot for Extracted SDGs Components.
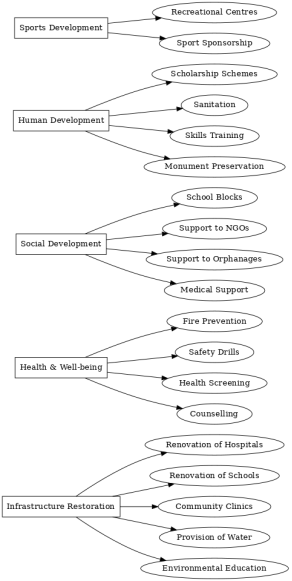
A component loading diagram demonstrates the visualisation of the clustering of variables under the extracted factors.
Figure 2. Component Loading Diagram.
4.2.1. Factor 1: Infrastructure Restoration
The first factor accounted for 17.186% of the total variance and comprised activities such as:
1) Renovation of hospitals
2) Renovation of schools
3) Building of community clinics
4) Provision of water
5) Environmental protection education
6) Supply of furniture to schools
These activities collectively represent investments in physical and social infrastructure aimed at improving community welfare and public services. The factor aligns closely with SDGs 3 (Good Health and Well-being), 4 (Quality Education), 6 (Clean Water and Sanitation), and 11 (Sustainable Cities and Communities).
The emergence of this factor as the dominant dimension suggests that construction firms primarily engage in sustainability activities that are physically visible, socially recognisable, and directly connected to their operational expertise. Infrastructure-related interventions are often more publicly noticeable and may therefore offer reputational benefits to firms while simultaneously fulfilling social obligations.
The relatively stronger performance of infrastructure-related activities compared to other dimensions supports findings from previous studies, which identified infrastructure delivery as one of the principal channels through which construction organisations contribute to sustainable development
| [6] | Boar, A., Bastida, R. and Marimon, F. (2022). “A systematic literature review of the sustainable development goals (SDGs) with managerial implications”, Sustainability, Vol. 14 No. 15, p. 9282. |
| [7] | Guevara, Z. and Julián, C. (2019). “The role of trade-offs and synergies in implementing the Sustainable Development Goals”, Sustainability Science, Vol. 14 No. 6, pp. 1629–1640. |
| [8] | Księżak, P. and Fischbach, B. (2018). “Triple Bottom Line: The Pillars of CSR”, Journal of Corporate Responsibility and Leadership, Vol. 4 No. 3, pp. 95–110. |
[6-8]
. Nevertheless, the moderate frequency scores indicate that such interventions are undertaken periodically rather than systematically integrated into long-term sustainability strategies.
4.2.2. Factor 2: Health and Well-being
The second factor explained 16.470% of the total variance and included:
1) Fire prevention education
2) Safety drills
3) Health education/screening
4) Provision of counselling
This factor reflects organisational efforts aimed at promoting occupational health, safety awareness, preventive healthcare, and disaster preparedness. The activities strongly align with SDG 3 (Good Health and Well-being) and SDG 11 (Sustainable Cities and Communities).
The prominence of safety drills and fire prevention education may partly be explained by the hazardous nature of construction work and increasing regulatory attention toward workplace safety management. Consequently, many firms may implement these activities not only as sustainability initiatives but also as compliance mechanisms aimed at reducing workplace accidents and liabilities.
Although the factor demonstrates growing awareness of health and safety responsibilities among construction organisations, the moderate frequency scores suggest that health-related sustainability interventions remain insufficiently institutionalised. This implies that many firms still approach health and well-being from a reactive rather than a strategic sustainability perspective.
4.2.3. Factor 3: Social Development
The third factor accounted for 15.713% of the total variance and comprised:
1) Building school blocks
2) Support to orphanages
3) Support for NGOs
4) Medical support to the poor and needy
This factor captures philanthropic and community-oriented interventions aimed at promoting social inclusion and improving living conditions among vulnerable populations. The activities align closely with SDGs 1 (No Poverty), 4 (Quality Education), 5 (Gender Equality), and 10 (Reduced Inequalities).
The grouping demonstrates that construction organisations contribute to broader community development beyond direct infrastructure delivery. However, the relatively lower mean scores suggest that these initiatives remain occasional rather than institutionalised organisational practices.
This finding may indicate that sustainability activities within many construction firms are still heavily dependent on corporate discretion, financial capability, or short-term community relations objectives rather than formal sustainability frameworks or policies.
4.2.4. Factor 4: Human Development
The fourth factor explained 13.081% of the total variance and included:
1) Scholarship schemes
2) Sanitation support
3) Skills training
4) Preservation of monuments
This factor represents long-term investments in human capital development, environmental sanitation, and cultural sustainability. The activities correspond with SDGs 4 (Quality Education), 6 (Clean Water and Sanitation), 8 (Decent Work and Economic Growth), and 11 (Sustainable Cities and Communities).
Among all extracted dimensions, sanitation recorded the highest mean score, indicating relatively stronger engagement by construction firms in sanitation-related interventions. This finding may reflect growing public awareness regarding environmental health and waste management within Ghanaian communities.
The inclusion of skills training within this factor is particularly important because the construction industry depends heavily on skilled labour. Firms that invest in training not only contribute toward SDG achievement but also improve labour productivity and workforce sustainability.
However, preservation of monuments recorded comparatively weaker scores, suggesting that cultural sustainability and heritage preservation receive relatively limited attention within construction sector sustainability practices.
4.2.5. Factor 5: Sports Development
The fifth factor accounted for 8.179% of the total variance and comprised:
1) Building recreational centres
2) Sponsorship of sporting activities
This factor reflects contributions toward recreation, youth empowerment, and community social cohesion. The activities broadly align with SDGs 3 (Good Health and Well-being) and 11 (Sustainable Cities and Communities).
The relatively low variance explained by this factor, together with its weak mean scores, indicates that sports-related interventions are not considered strategic sustainability priorities by most construction organisations. Compared with infrastructure and sanitation projects, sports development may be perceived as less directly connected to firms’ operational mandates and business objectives.
This finding suggests that construction firms tend to prioritise sustainability initiatives that provide stronger economic, reputational, or regulatory visibility.
4.3. Reliability and Internal Consistency Analysis
Table 3 shows the reliability of the extracted constructs was assessed using Cronbach’s alpha coefficients. The results showed acceptable internal consistency across all dimensions, with coefficients exceeding the recommended threshold of 0.70
| [10] | Eccles, R. G., Lee, L. E. and Stroehle, J. C. (2020). “The social origins of ESG: An analysis of Innovest and KLD”, Organization & Environment, Vol. 33 No. 4, pp. 575–596. |
[10]
.
Table 3. Reliability and Internal Consistency Analysis.
Construct | Cronbach’s Alpha |
Infrastructure Restoration | 0.821 |
Health and Well-being | 0.847 |
Social Development | 0.803 |
Human Development | 0.791 |
Sports Development | 0.754 |
Overall Scale | 0.868 |
The findings confirm that the measurement items within each construct were sufficiently correlated and consistently measured the underlying sustainability dimensions.
4.4. Correlation Analysis of SDGs Dimensions
Pearson correlation analysis was conducted to examine the relationships among the extracted SDGs dimensions. The results revealed significant positive relationships among all five dimensions (p < 0.05), indicating that firms engaging in one sustainability activity were more likely to participate in others.
The strongest relationship was observed between Infrastructure Restoration and Human Development. This suggests that firms investing in infrastructure-related interventions also tend to support sanitation, scholarship schemes, and skills development initiatives. The findings support the assumptions of the Triple Bottom Line framework, which emphasises the interconnectedness of social, environmental, and economic sustainability dimensions.
The positive interrelationships further indicate that sustainability engagement within construction organisations is multidimensional rather than isolated to specific activities.
4.5. Regression Analysis of Factors Influencing SDGs Contributions
Multiple regression analysis was conducted to examine whether organisational characteristics influenced SDGs engagement levels.
The analysis revealed that years of company existence and respondents’ years of industry experience significantly influenced SDGs engagement (p < 0.05). Older firms and firms managed by more experienced professionals demonstrated relatively stronger participation in sustainability activities.
This finding suggests that organisational maturity contributes positively toward sustainability awareness, stakeholder engagement, and implementation capacity. Established firms may possess greater financial resources, stronger institutional legitimacy, and increased stakeholder pressure to engage in socially responsible activities.
However, the moderate explanatory power of the regression model indicates that additional external factors, such as government policy, sustainability regulations, economic conditions, and organisational culture, may also influence sustainability engagement within the construction industry.
4.6. Fuzzy Synthetic Evaluation of SDGs Activities
Following factor extraction, the Fuzzy Synthetic Evaluation Model (FSEM) was employed to evaluate the frequency and relative significance of SDGs activities undertaken by construction organisations see
Table 4.
The results revealed that Human Development recorded the highest index value (2.728), followed by Infrastructure Restoration (2.693), Health and Well-being (2.690), Social Development (2.673), and Sports Development (2.455).
Although Human Development ranked highest, all dimensions recorded index values below 3.0, indicating that sustainability activities are generally undertaken infrequently.
Importantly, the conclusion that construction organisations’ contributions are “rare” was not based solely on descriptive mean scores. Rather, the interpretation was benchmarked against the linguistic scale adopted in the study and supported by comparative findings from studies conducted in developed economies, where sustainability integration appears more institutionalised and strategically embedded
| [6] | Boar, A., Bastida, R. and Marimon, F. (2022). “A systematic literature review of the sustainable development goals (SDGs) with managerial implications”, Sustainability, Vol. 14 No. 15, p. 9282. |
| [7] | Guevara, Z. and Julián, C. (2019). “The role of trade-offs and synergies in implementing the Sustainable Development Goals”, Sustainability Science, Vol. 14 No. 6, pp. 1629–1640. |
| [8] | Księżak, P. and Fischbach, B. (2018). “Triple Bottom Line: The Pillars of CSR”, Journal of Corporate Responsibility and Leadership, Vol. 4 No. 3, pp. 95–110. |
[6-8]
.
Compared with sustainability benchmarks emphasising continuous and proactive SDGs engagement, the observed scores suggest that many Ghanaian construction firms remain at an early or moderate stage of sustainability implementation. The findings, therefore, imply that sustainability activities are still largely peripheral rather than integrated into core organisational strategies.
The relatively weak sustainability performance observed across all dimensions may be attributed to:
1) limited regulatory enforcement,
2) inadequate sustainability awareness,
3) financial constraints,
4) weak institutional pressure,
5) and absence of structured sustainability reporting frameworks.
These findings suggest that sustainability engagement among construction organisations in developing economies remains largely reactive and compliance-driven rather than innovation-oriented and strategically integrated.
Table 4. Sustainable Development Goals activities by construction organisations. Sustainable Development Goals activities by construction organisations. Sustainable Development Goals activities by construction organisations.
Code | | Mean | Weighting for each SDGs | Total Mean | Weighting for each CSRF |
| Infrastructure restoration | | | 16.098 | 0.305 |
SAN1 | Building of community clinic | 2.70 | 0.168 | | |
SAN2 | Environmental protection education | 2.59 | 0.161 | | |
SAN3 | supply of furniture to schools | 2.66 | 0.165 | | |
SAN4 | Renovation of Hospitals | 2.59 | 0.161 | | |
SAN5 | Renovation of school | 2.96 | 0.184 | | |
SAN6 | Provision of water | 2.60 | 0.162 | | |
| Health and well-being | | | 10.695 | 0.202 |
HES1 | Health Education/Screening | 2.96 | 0.276 | | |
HES2 | Fire prevention Education | 2.63 | 0.246 | | |
HES3 | Safety Drills | 2.78 | 0.260 | | |
HES4 | Provision of counselling | 2.32 | 0.217 | | |
| Social development | | | 10.651 | 0.202 |
RS1 | Building school blocks | 2.70 | 0.253 | | |
RS2 | Support to orphanages | 2.83 | 0.266 | | |
RS3 | support for the work of NGOs | 2.42 | 0.227 | | |
RS4 | Medical support to the poor and needy | 2.70 | 0.254 | | |
| Human development | | | 10.530 | 0.199 |
SO1 | Provision of Scholarship scheme | 2.42 | 0.230 | | |
SO2 | Sanitation | 3.46 | 0.328 | | |
SO3 | Provision of skills training | 2.57 | 0.244 | | |
SO4 | Preservation of monuments | 2.08 | 0.197 | | |
| Sports development | | | 4.882 | 0.092 |
SA1 | Building of Recreational centres | 2.26 | 0.464 | | |
SA2 | Sponsorship of sporting activities | 2.62 | 0.536 | | |
| | | | 52.856 | |
Table 5. Membership Function of Corporate Social Responsibility Activities.
Code | | Weight | Membership Function Level 3 | Membership Function Level 2 |
| Infrastructure Restoration | | | |
SAN1 | Building of community clinics | 0.168 | 0.278, 0.178, 0.178, 0.300, 0.067 | 0.283, 0.192, 0.163, 0.277, 0.085 |
SAN2 | Environmental protection education | 0.161 | 0.256, 0.289, 0.122, 0.278, 0.056 | - |
SAN3 | supply of furniture to schools | 0.165 | 0.311, 0.233, 0.089, 0.222, 0.144 | - |
SAN4 | Renovation of Hospitals | 0.161 | 0.330, 0.121, 0.209, 0.308, 0.033 | - |
SAN5 | Renovation of school | 0.184 | 0.222, 0.122, 0.211, 0.367, 0.078 | - |
SAN6 | Provision of water | 0.162 | 0.308, 0.220, 0.165, 0.176, 0.132 | - |
| Health and well-being | | | |
HES1 | Health Education/Screening | 0.276 | 0.200, 0.222, 0.122, 0.333, 0.122 | 0.277, 0.216, 0.148, 0.254, 0.105 |
HES2 | Fire prevention Education | 0.246 | 0.222, 0.244, 0.244, 0.256, 0.033 | - |
HES3 | Safety Drills | 0.260 | 0.261, 0.261, 0.068, 0.250, 0.159 | - |
HES4 | Provision of counselling | 0.217 | 0.456, 0.122, 0.167, 0.156, 0.100 | - |
| Social development | | | |
RS1 | Building school blocks | 0.253 | 0.303, 0.213, 0.146, 0.157, 0.180 | 0.285, 0.208, 0.166, 0.234, 0.107 |
RS2 | Support to orphanages | 0.266 | 0.256, 0.156, 0.189, 0.300, 0.100 | - |
RS3 | support for the work of NGOs | 0.227 | 0.286, 0.297, 0.176, 0.198, 0.044 | - |
RS4 | Medical support to the poor and needy | 0.254 | 0.297, 0.176, 0.154, 0.275, 0.099 | - |
| Human development | | | |
SO1 | Provision of Scholarship scheme | 0.230 | 0.300, 0.300, 0.178, 0.122, 0.100 | 0.276, 0.206, 0.162, 0.222, 0.134 |
SO2 | Sanitation | 0.328 | 0.100, 0.111, 0.211, 0.389, 0.189 | - |
SO3 | Provision of skills training | 0.244 | 0.348, 0.236, 0.101, 0.124, 0.191 | - |
SO4 | Preservation of monuments | 0.197 | 0.455, 0.216, 0.136, 0.182, 0.011 | - |
| Sports development | | | |
SA1 | Building of Recreational centres | 0.464 | 0.374, 0.253, 0.154, 0.176, 0.044 | 0.324, 0.202, 0.222, 0.202, 0.050 |
SA2 | Sponsorship of sporting activities | 0.536 | 0.281, 0.157, 0.281, 0.225, 0.056 | - |
The membership function (Level 2) presented in
Table 5 provided the basis for estimating the indices of the main factors (constructs). The indices were obtained from the product of the scale responses (ratios) and the membership function Level 2 matrix.
From
Table 6, the first-ranked sustainable development goals activity was human development, with an index of 2.728, indicating that the activity of supporting human development was rare. The second SDGs activity was Infrastructure Development, which recorded an index of 2.693 (rarely undertaken). Health and Well-being and Social Development also recorded indices of 2.69 and 2.673, respectively, and ranked 3rd and 4th. It was observed that Sports Development activities, with an index of 2.455, were the least undertaken activity in the community.
Table 6. Overall Indices for SDGs Factors.
Items | Index | Linguistics | Rank |
Human Development | 2.728 | Rare | 1 |
Infrastructure Restoration | 2.693 | Rare | 2 |
Health and Well-being | 2.690 | Rare | 3 |
Social Development | 2.673 | Rare | 4 |
Sports Development | 2.455 | rare | 5 |
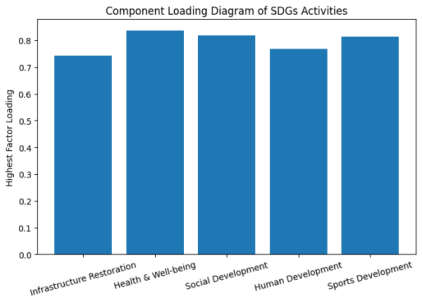
A bar chart was included to visually compare the fuzzy index values of the five SDGs dimensions.
Figure 3. Bar Chart of Fuzzy Synthetic Evaluation Indices.
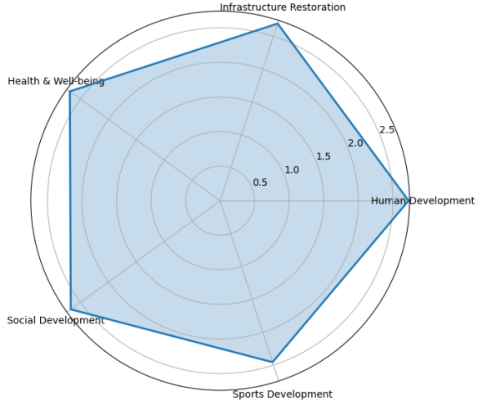
The radar chart reveals uneven sustainability engagement across dimensions, with relatively stronger performance in Human Development and Infrastructure Restoration and weaker performance in Sports Development.
Figure 4. Radar Chart of SDGs Sustainability Dimensions.
This study found that construction organisations in developing economies, such as Ghana and similar countries, engage in activities that contribute to the achievement of the Sustainable Development Goals (SDGs). The study revealed that construction organisations mainly contribute to human development activities linked to SDG 2, SDG 13, SDG 14, SDG 6, SDG 11, and SDG 4. This was followed by infrastructure restoration activities associated with SDG 3, SDG 13, SDG 14, SDG 6, SDG 11, and SDG 4. In addition, contributions to health and well-being were linked to SDG 3, SDG 8, SDG 11, and SDG 1. Social development activities connected to SDG 2, SDG 4, SDG 5, SDG 7, SDG 10, and SDG 11 ranked as the third and fourth most common SDG-related activities undertaken by construction organisations. However, sports development activities linked to SDG 1 and SDG 9 were found to be the least prioritised among the SDG-related initiatives undertaken by construction organisations.
The findings further indicate that although construction organisations contribute to the Sustainable Development Goals, these activities occur infrequently, suggesting that their overall contribution remains limited.
These findings are supported by previous studies.
| [1] | United Nations. (2015). Transforming Our World: The 2030 Agenda for Sustainable Development. United Nations, New York. |
[1]
found that construction organisations contribute to the development of recreational centres and the sponsorship of sporting activities, which align with SDG 11 (Sustainable Cities and Communities) by promoting inclusive and equitable urban development. Similarly,
| [2] | Halkos, G. and Gkampoura, E. C. (2021). “Where do we stand on the 17 Sustainable Development Goals? An overview on progress”, Economic Analysis and Policy, Vol. 70, pp. 94–122. |
[2]
reported that the provision of water infrastructure projects ensures access to clean water and sanitation, thereby supporting SDG 6 (Clean Water and Sanitation), which is essential for community health and well-being. Furthermore,
| [3] | Ashraf, M., Ullah, L., Shuvro, M. A. and Salma, U. (2019). “Transition from Millennium Development Goals (MDGs) to Sustainable Development Goals (SDGs): Blueprint of Bangladesh for implementing the Sustainable Development Goals (SDGs) 2030”, Medicine Today, Vol. 31 No. 1, pp. 46–59. |
[3]
argued that supplying furniture to schools and constructing school buildings directly support SDG 4 (Quality Education) and SDG 11 (Sustainable Cities and Communities) by improving access to quality learning environments in underserved communities.
Additionally,
| [4] | Fonseca, L. M., Domingues, J. P. and Dima, A. M. (2020). “Mapping the sustainable development goals relationships”, Sustainability, Vol. 12 No. 8, p. 3359. |
[4]
highlighted that the construction industry's social contributions, such as scholarships for students, support for orphanages, and medical assistance for vulnerable populations, align with SDG 10 (Reduced Inequalities) and SDG 1 (No Poverty). Similarly,
| [5] | McCollum, D. L., Echeverri, L. G., Busch, S., Pachauri, S., Parkinson, S., Rogelj, J., et al. (2018). “Connecting the sustainable development goals by their energy inter-linkages”, Environmental Research Letters, Vol. 13 No. 3, p. 033006.
https://doi.org/10.1088/1748-9326/aaafe3 |
[5]
emphasised that construction organisations contribute to several SDGs, including SDG 2 (Zero Hunger), SDG 3 (Good Health and Well-being), SDG 4 (Quality Education), SDG 6 (Clean Water and Sanitation), SDG 7 (Affordable and Clean Energy), SDG 8 (Decent Work and Economic Growth), SDG 9 (Industry, Innovation, and Infrastructure), SDG 10 (Reduced Inequalities), SDG 11 (Sustainable Cities and Communities), and SDG 13 (Climate Action).
The significance of this study lies in its contrast with previous studies that suggest construction organisations contribute substantially to the achievement of the SDGs. In contrast, the present study found that construction organisations are only minimally engaged in activities that support the SDGs, despite the significant environmental, social, and urban impacts associated with their operations.